How I made a simple no-code ‘app’ to track my happiness at work
When you spend 40 hours a week at work, you want to enjoy your job. But burnout is everywhere, and countless things are vying for your time and energy. Often it is hard to understand how you objectively feel about your job and workdays. “Do you hate your job, or is this just Covid?” You may be in a great job, but the way you spend your time could be draining.
After going through the slog of working through a global pandemic, I wanted to understand my workdays better. So I decided to experiment with tracking and measuring my happiness at work.
Understanding and tracking workdays can do one of two things:
- Identify if it is time for a job change
- Expose patterns around what makes a good or bad day
Building my tracker
When I set out to build a tracker, I identified a couple of things I needed for the experiment to be a valuable and sustainable solution:
- Consistency (inputs triggered at the same time every day)
- Low time cost (it can’t consume lots of my time)
- History and pattern matching
- Questions that feel relevant to me
With this in mind, I decided I could achieve this with a simple ‘no-code’ stack: Slack, Google Forms, Google sheets.
The tracker setup
The first thing I did was create a Google Form. I compiled a list of multiple-choice intentional questions that I could answer daily. The first question is a summary question identifying my overall feeling about the day. The follow-up questions are specific to what happened in the day. The intent was that the follow-up questions could help me correlate traits that impact my overall feeling of the day. Here is the question set I used:
- The main question: How was your day? [Good, Meh, Bad]
- Did you have time to play (design)? [Yes, No]
- Did you feel connected to your teammates? [Yes, No]
- Was is it a heavy meeting day? [Yes, No]
- Did you feel like you made progress? [Yes, No]
- How did your day feel? [Proactive, Reactive]
- Additional notes [optional, text]
Google forms has a simple visualization system for form data. It is powerful, but it didn’t fit my needs. I wanted a visual way to parse information and connect the dots, so I connected the form data to a spreadsheet. I love formatting spreadsheets, and the powerful part of this simple application is the visualized data.
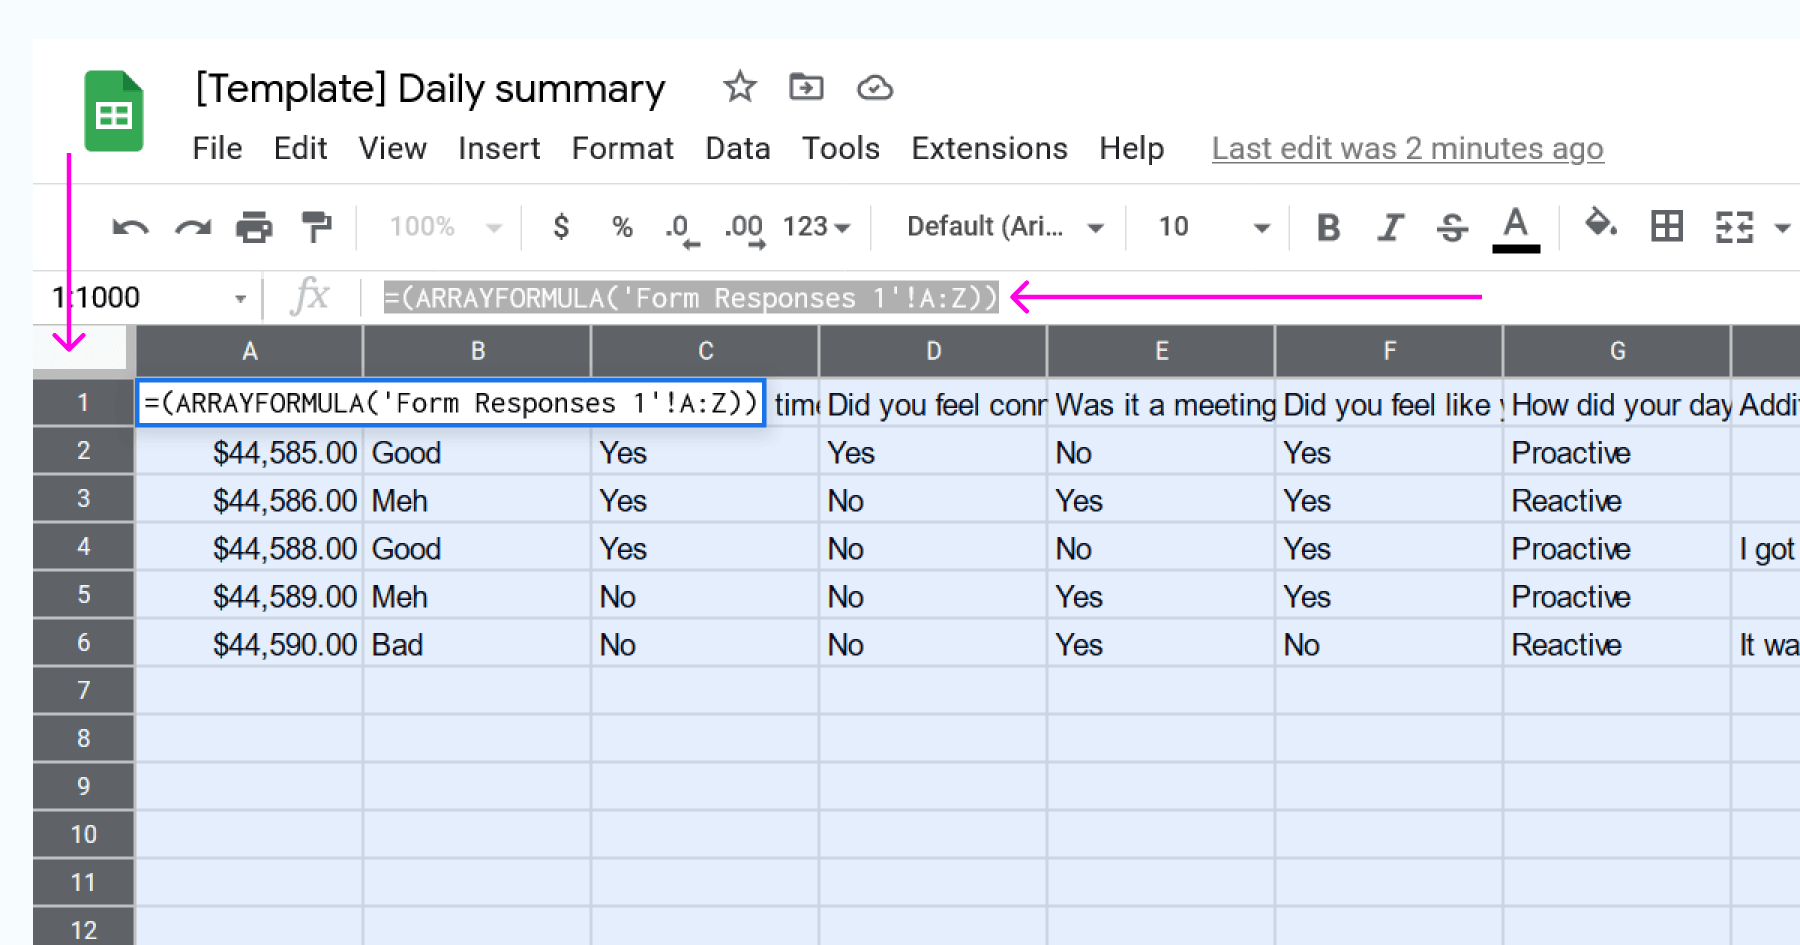
Along the way, I discovered that you couldn’t style the raw data that the Google form captures. New form submissions will break your spreadsheet if you style raw data. But there is a solution. Duplicate your data into a new sheet.
To duplicate your form data:
- Create a new Sheet (tab) at the bottom of your Google sheet
- In the new Sheet, click the top left most cell in the new Sheet and add this formula: =(ARRAYFORMULA(‘Form Responses 1’!A:Z)) Note: the ‘Form Responses 1’ needs to be named the same as the tabbed sheet name where your raw form data is collected.
Once I had data that I could style, it was time to play. I utilized Google Sheets Conditional formatting. With conditional formating, “Cells, rows, or columns can be formatted to change text or background color if they meet certain conditions. For example, if they contain a certain word or a number.”
I prioritized my summary questions answers since that was the barometer to identify how my days were going. Then, I formatted the other questions in red and green depending on whether I considered the answer positive or negative. This allows me to pattern-match and identifies what makes a great day.
When my spreadsheet was ready, I published it as a read-only webpage viewable only by me. Here is the published page from my sample document. To publish a Sheet, go to File > Share > Publish to Web. From the menu, select your formatted Sheet, and set who can open the webpage with publishing restrictions.
Once my data input and visualization were ready, I needed to add a reminder. Again, I went with the path of least resistance, which in my case was a Slackbot reminder. I have a reminder to fill out my daily summary set for 5 pm PST every weekday. I have a link to my Google Form and my published visualization web page in the reminder. It is straightforward if you aren’t familiar with setting up a Slackbot reminder. Here is a link to help guide you set up a reminder.
That’s it. I have been using my tracker for a couple of months and have identified some themes. I found that feeling connected to my teammates and time for designing impacted my days tremendously. So I have intentionally carved out time for my teammates and protected my heads-down design time.
Hopefully, this will inspire you to go out and create a similar tracker for yourself or build something else fun!
Here is a duplicate of my spreadsheet populated with sample data if you are interested. View the sample page of the app.